

Visualisation
 KeyTo visualizes control-related content and data via a modern browser-based User Interface. Three different options for presentation and analysis are available:
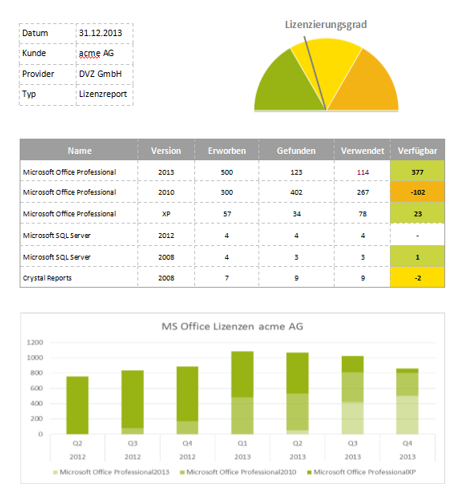
keyto.rep
Customized reports depict key metrics across time periods for specified target groups, delivering exactly the information required for individual business roles and activities. Reports are created periodically, on demand or automatically; for example, when defined thresholds are exceeded or under achieved. The reports can be created in standard data formats (pdf, rtf, xls, or csv). Customizable templates are accessible via email or web browser.
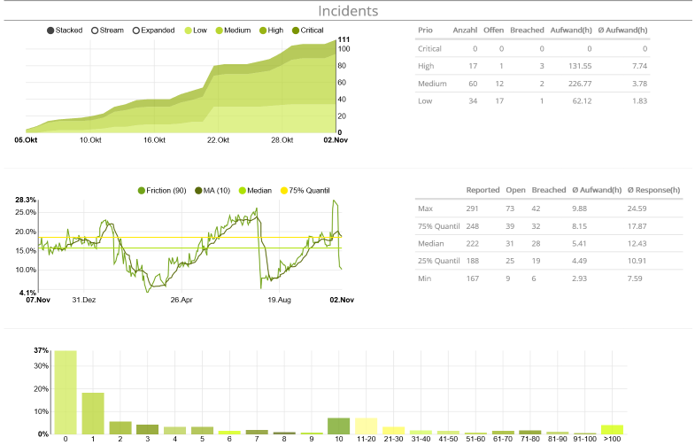
keyto.panel
Dynamic dashboards provide a readily available overview of most recent company performance results, as a total and/or by specific business initiative.
Real-time data is evaluated so that one can easily identify and manage business goal discrepancies.
KeyTo resolves limitations in data evaluation
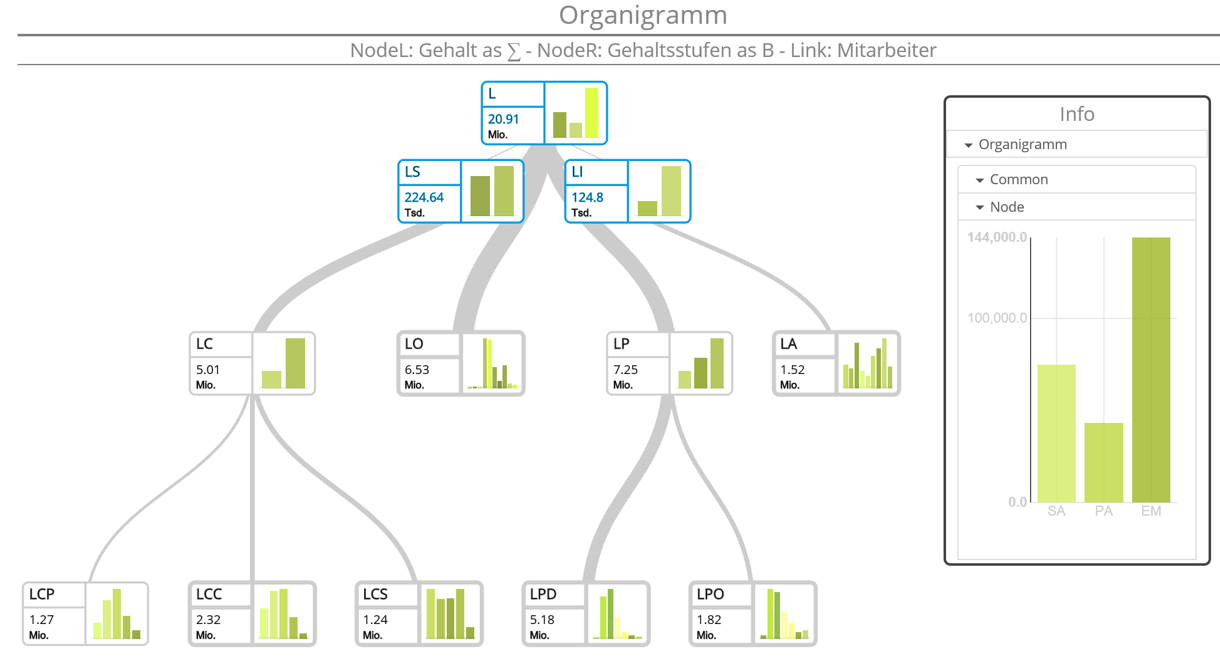
keyto.adhoc
Multifunctional slice & dice and drill-down features to analyse complex situations. This ad hoc module allows individual, extensive, thorough, and in-depth analysis to be performed with little effort, keeping track of the big picture along with the capacity to quickly refer to its relevant details.
Whether for corporate management or operational staff, a customized view providing vital information relevant and appropriate for the job at hand can be provided at any time in a fast and easy way.
Analysis across all important business areas is made easy.